Thank You Vibeke Manniche! The Denmark team finally hit a soft spot...
Vibeke makes some valuable observation on the "Not cleaned data" in the Denmark and Swedish data.
Previous Denmark article: HERE
Did you hear that folks, “not clean(ed) data” or raw data is something that was addressed by Max Schmelling and I assume verified by someone in the “peer review” analysis of this Hot/Placebo batch dependent study? What does this mean? Could it mean that there are typos, missing data elements or missing fields like an empty age field, empty gender field, batch numbers with typos, special character or lot numbers somehow truncated? Does this mean Max had to identify these lacking reports and then use some deductive reasoning to determine what the ethical proper and appropriate data was and manually “clean” reports before analysis even begins?
You are in my wheel house Vibeke, it’s what I’ve been screaming about since jumpstreet, which is lingo that means “day one” here in America. What Vibeke is describing is what we in data analytics and data visualization biz call data modeling. The term “modeling” is ambiguous itself as it could cover a lot of ground starting at the low hanging fruit like changing all data to upper case and eliminating special characters and extra spaces where applicable. What Vibeke is describing is something a little more cumbersome and potentially more complex depending on the tools being used. Is the technique low brow, low complexity, low dynamics, wax on wax off, manually reading of reports and manually populating an Excel spreadsheet? Maybe you read the victim has heavy menstrual bleeding but has unknown gender? Elementary my dear Watson, let me go plug in “F” in the gender field.
Is there something more this millennium or this decade that could dynamically help me find these obfuscations? Some kind of app, language, script or algorithm like Python Probability tools today’s Simpletons might just simply call AI? Back in the old days we called something similar to this activity conditional matching, fuzzy logic, V-look ups with offset, all of which comes free in Microsoft Excel, Apple Sheets, Monarch, or what have you, and if you can figure out how and when to use it. Let me tell you this world, Natural Language Processing (NLP), Natural Language Learning and this “new” industry of data modeling is like the game of chess. Data modeling is like a spreadsheet in the respects that most people will say, yeah I know MS Excel or yes I know how to play chess. However some people use MS Excel to build blue prints to shopping mall, and only few chess players are Grand Masters. It was a little telling how Vibeke waved her fingers around and deferred to Max Schmelling’s expertise saying it took him a couple weeks to model the data. God Bless Vibeke’s heart, I think you may have discounted Max’s abilities a bit, and I’m sure it’s only one small piece of the pie of all that Max does or can do, but I will show the world now what I have done for the VAERS Denmark data, and what I have done for all other countries back to 1990, since jumpstreet.
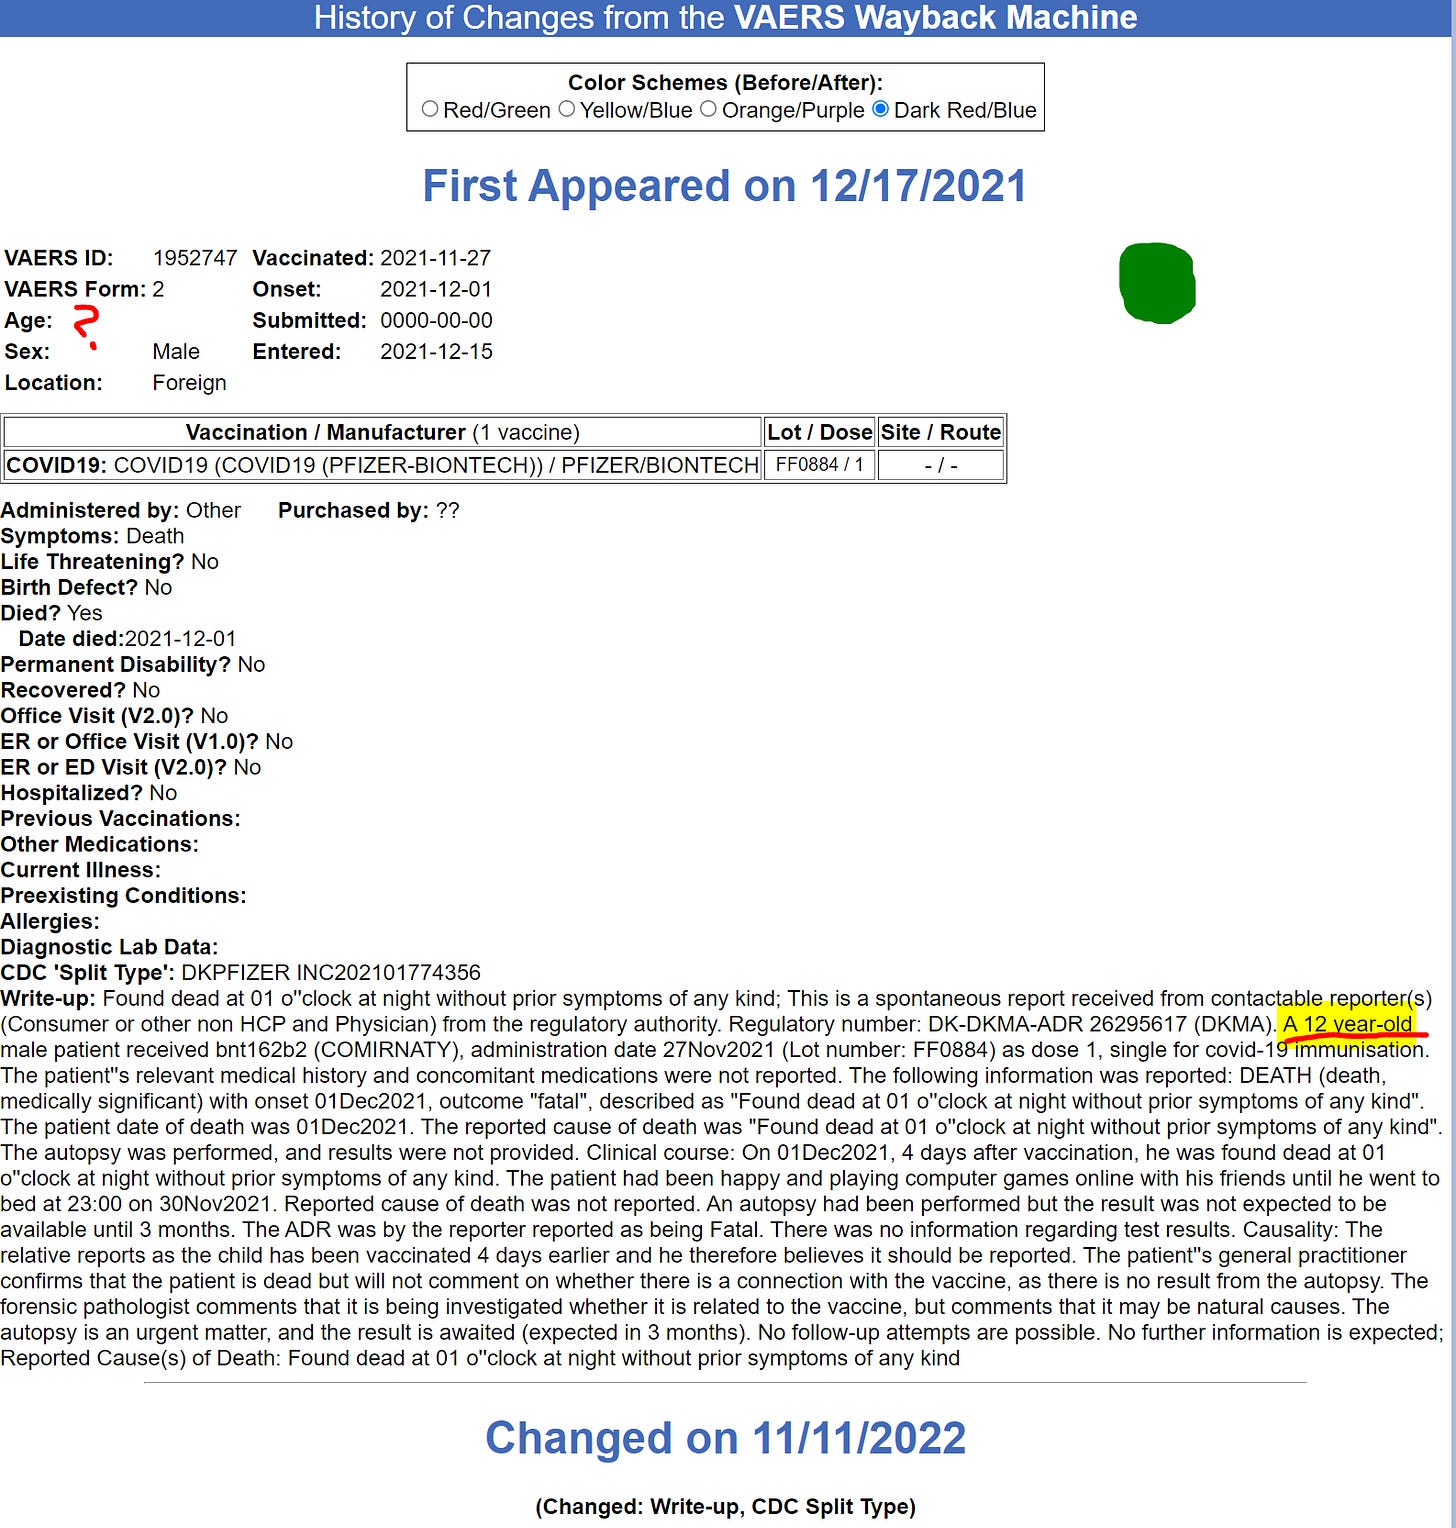
With the simple tabulation above please focus on #10 to #13. Of the 5,155 Denmark reports in VAERS 3,200 of these reports had a unknown age which is the same as saying the age field was empty! However, when reading the summary narrative you can find and calculate the victims age is properly documented in 3,092 of 3,200 UNK AGE reports! VAERS says there is 60 children reports (0-17yrs), but slicing and dicing with my dashboards you will find and can easily read 223 children’s reports including 7 kid deaths like this one:
You notice how hard it is for the average Simpleton first to know what it is they are looking for, then to go into Medalert’s Wayback Machine and pull the report? This is what the report looks like today in MedAlerts without the Wayback tool:
The details are hiding in (history). The Eagle’s eye and viz looks like this view from the dashboard.
I wonder if Vibeke, Max, and Vibeke’s husband properly up-coded the cerebrovascular strokes, myo/pericarditis, pulmonary embolisms and all the other stuff there is to easily up-code as “serious”? Here is just a snippet of 155 Denmark reports I up-coded based on just symptoms.:
A small disclaimer about the logic of upcoding based on easily identifiable symptoms, I would not up-code echocardiogram or dizziness by itself, but if it was associated with a symptom of myocarditis, the whole report gets up-coded and all symptoms associated.
Here is a sample of 5 cerebrovascular accidents but considered not serious “safe & effective” strokes because no event level box is marked off. ID# 2369589 is from a yellow batch…
Thank you Vibeke, because of you I decided to do better and add a few more permanent visuals to the main dashboard to help address what is going on with this gender disparity in Denmark and possibly in correlation to the world.
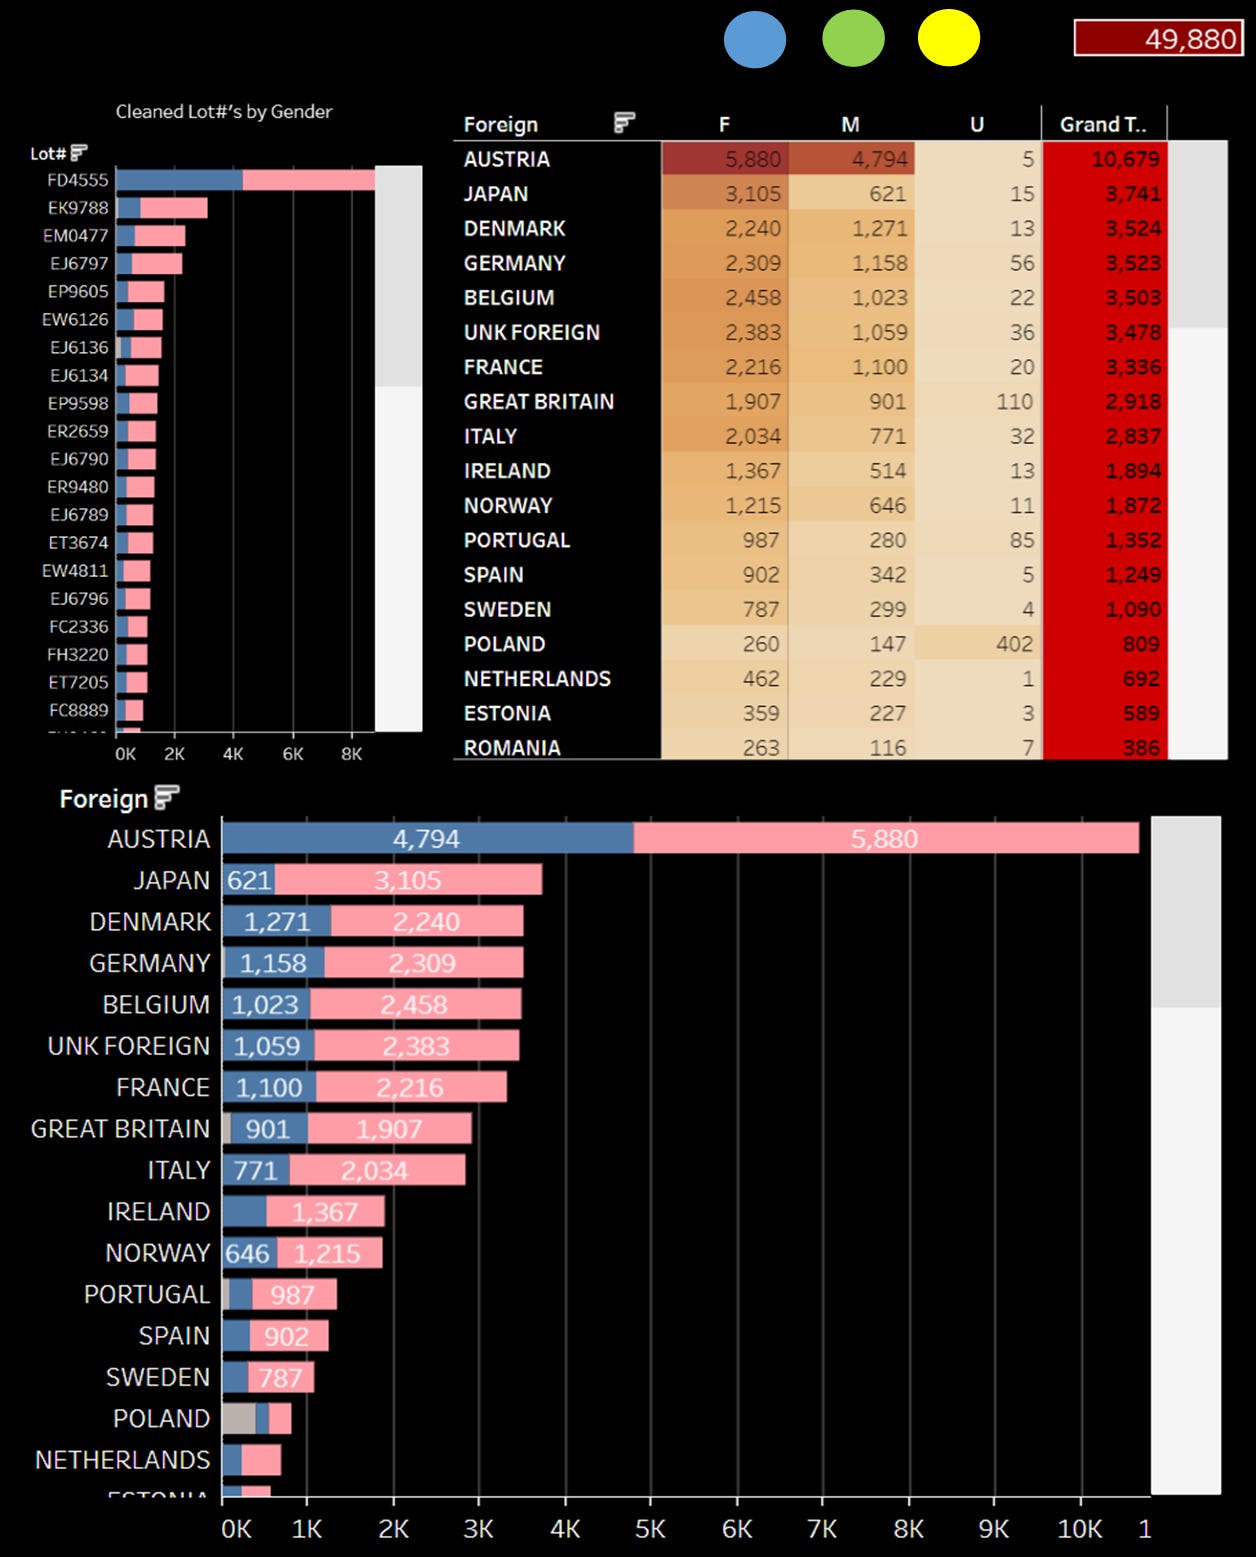
Here is one of the visuals I’m trying to achieve with this live up to date data:
As you can see, Denmark clocks in at country #26 with 5,155 total reports also tabulated by gender. Nothing looks particularly interesting about Denmark at this macro level but things do get interesting as we begin to dissect the data…
A disclaimer I need to make about gender is that I have not done a thorough ethical “cleansing” on gender in quite a very long time for Unknown Gender Reports, you can consider our published data set as the raw un-edited version.
Poland is absolutely horrible about properly populating the gender field.
What’s up with Great Britain and Ireland? Keep in mind these reports are all being curated at every level. One thing is for sure, 99.999% of all foreign reports are being cross-walked through the manufacturer and then to VAERS. At face value we are forced to believe all this “unclean” data is a product of the original submitter like the healthcare professional or victim or friend of a victim. It’s reasonable to believe these pharmacofraudlance systems and manufacturers are not doing us any favors by ethically cleaning the data in transit and before publication. I would bet the farm General Dynamics IT and high level administrators are dynamically stripping data like age, vax dates, death dates, lot numbers, etc. that were present upon initial submission. You definitely know there is a few studs like me cleaning what ever needs to be cleaned in the initial submission, however, the public doesn’t get to see the finished “cleaned” report. The lowest level people are called claims adjudicators and would probably be pinging the original submitter for additional info like a missing vax date or lot# or any other conformation that is needed. This is really no different than HMO claims auditing and processing for reimbursement to providers for services rendered. I’m an expert in that, but I’m not a scientist so I guess I do not get the opportunity to see the raw data Vibeke possesses.
Welcome to my new visuals!
Do you see how just focusing on the arbitrary B,G,Y batches Netherlands doesn’t look as dramatic and Japan looks really interesting, more interesting than Denmark? Disclaimer, I’m working on the country gender heat map looking viz to get percentages and added details so help interesting details pop-out better. Moreover, hovering over the histogram bars with your mouse or tapping on your Ipad reveals a “tool tip” with additional details.
So now we are up to 40 different visuals that makes up this main dashboard. Working from my Tableau Desktop version I have a few more visualization I don’t even put into production, I use this area like my scratch pad or tool box to hunt for things I’m looking for.
Around here, I always say finding a needle in a haystack is easy, creating tools to finding a certain needle in a stack of needles is when I get excited! God Bless, I’m going to turn over every stone and wait for people to catch up.
Please please pretty please support The Eagle!
https://www.vaersaware.com/donate
Sign the Federal Investigation petition:


Let's not forget searching for typos as spelling mistakes....
Great job
"One thing is for sure, 99.999% of all foreign reports are being cross-walked through the manufacturer and then to VAERS. "
Perfect reminder collaborative data handling can be done with sufficient motivation the only problem is that they join forces to obscure truth not expose it.. lucky we have you Albert!! <3