Reports of Batch-Dependent Suspected Adverse Events of the BNT162b2 mRNA COVID-19 Vaccine: Comparison of Results from Denmark and Sweden
By: Vibeke Manniche, Max Schmeling, Jonathan D. Gilthorpe, Peter Riis Hansen
Source: https://www.mdpi.com/1648-9144/60/8/1343
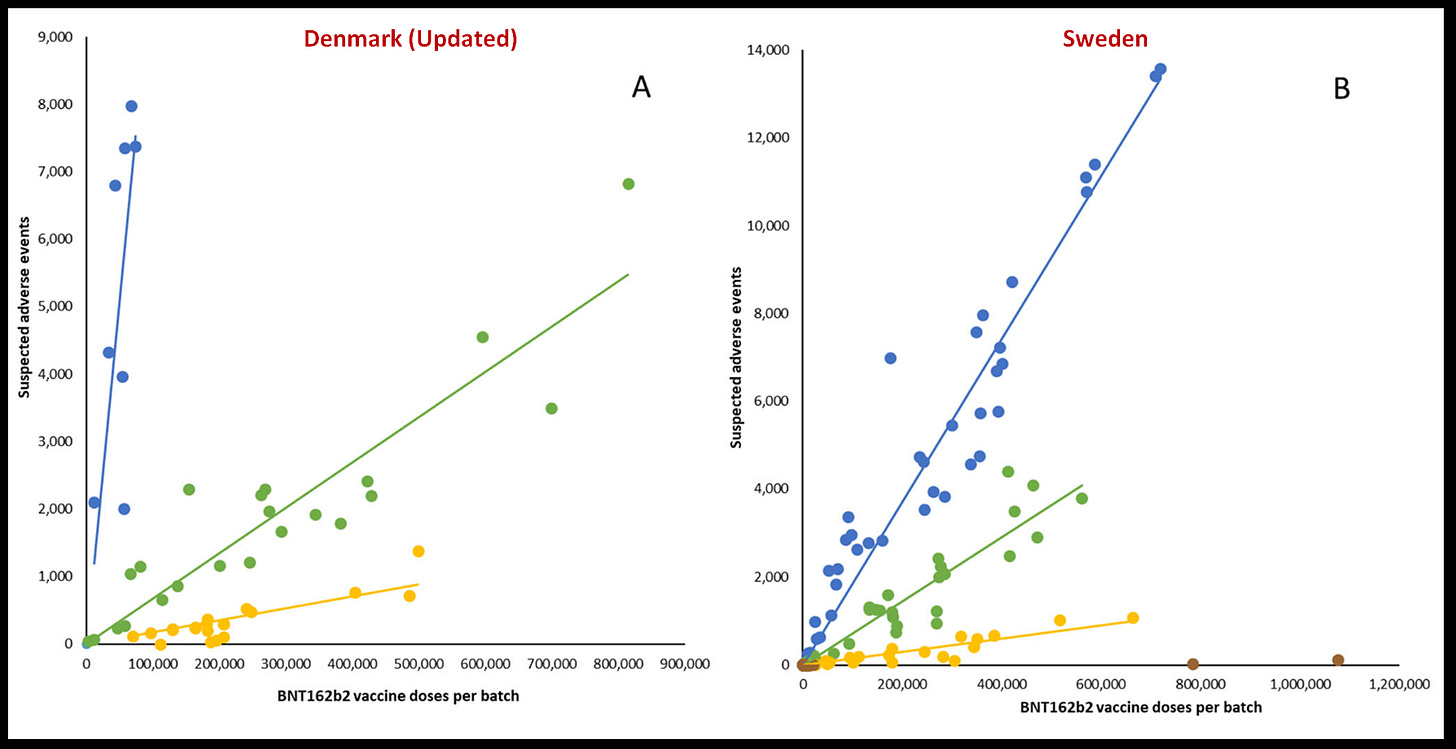
Image above is the money shot of this new study. The authors have quietly updated their original study with the “backlog” of reports that weren’t available to them initially. The original Denmark Study was published March 30, 2023, but the data reflected vaccination dates up to Jan 11, 2022.
I predict the Denmark authors are going to immediately update this whole study ASAP because it has obvious errors/oversights and is very confusing to the discerning eye.
They say this Figure 1A is for vaccinations in Denmark Dec 12, 2020 to Jan 11, 2022
However, here is the comparison between the original and now updated Denmark
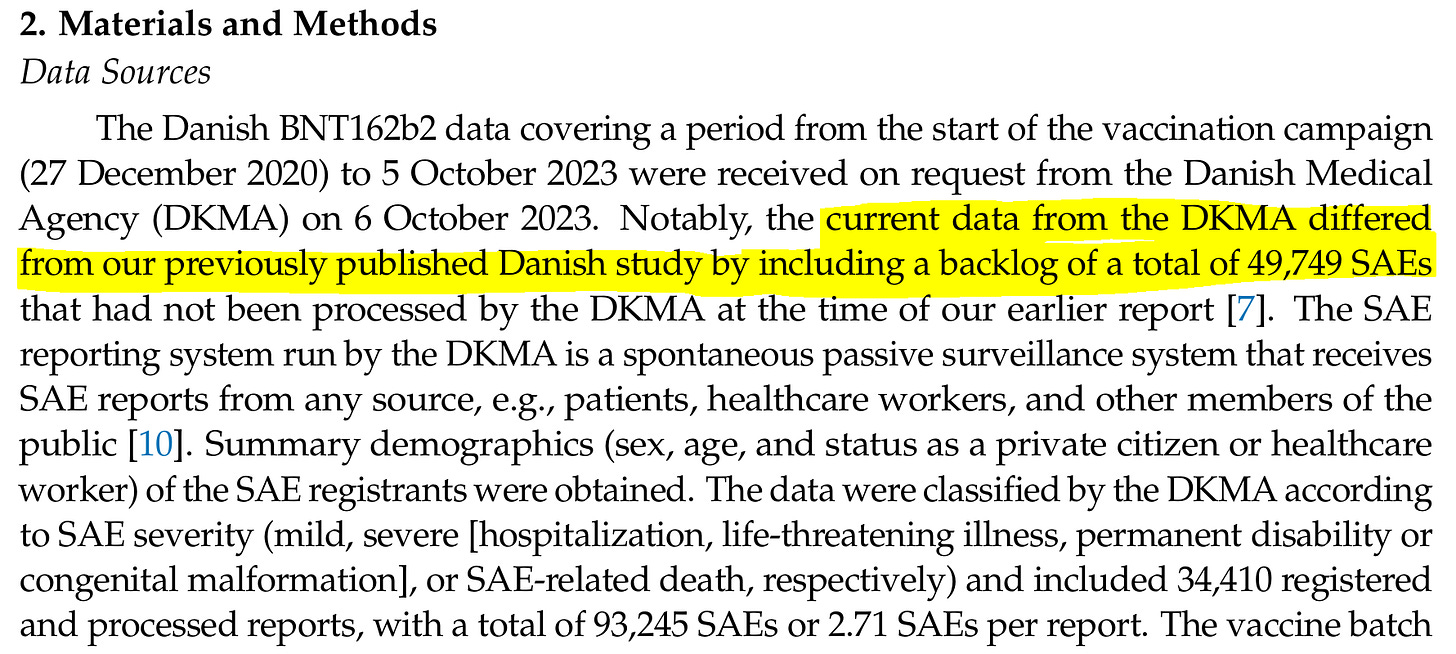
The Denmark authors make a blurb about the additional 49,749 SAE’s here:
49,749 SAEs great and understood, they even describe what a Severe Adverse Event (SAE) is [hospitalization, Life Threatening, Permanent Disability, Birth Defect/Malformation, and Death]. This is exactly how it’s defined in the American VAERS system. Therefore, not “severe” aka a non-severe regular adverse event would be Emergency, Office Visit, None of The Above (no AE box marked). NOT SAE = AE
Here is one small huge problem I have is with these author’s terminology, they seem to use SAE and AE interchangeably at times? First of all let’s see where these extra 49,749 SAEs (backlog) came from?
In the minutiae you see the registered people (aka unique reports) jumped from 13,635 to 34,410 and account for more than twice the SAE’s just from the backlog? I’m not clear if by vaccination date we are still talking about only those vaccinated up to Jan 11, 2022 like in their original Denmark study? By all indications in this new study, I have to assume it is.
In the Before/After Denmark Study graph you can see that most of these “backlog” SAEs are coming from the yellow and green dot lots. This is what I’ve been saying this whole time, it’s because they are the newest lots, newest reports, and purposefully delayed reports to be published. I have also been precise NOT to call this backlog, but rather THROTTLING (purposeful delay publishing).
What happened to the yellow dot placebo lots? How did this initial study and these Yellow dots come to be called Placebo lots and harmless? They are NOT harmless and even have some deaths associated to these yellow dot lots! They are just seemingly less toxic that blue and green dot lots for now. We are still getting these “throttled reports coming into VAERS, even in the very last update.
"Vaccination" batches: study proves frightening facts - Punkt.PRERADOVIC with Prof. Dr. Gerald Dyker and Prof. Dr. Jörg Matysik (English subtitles)
You can watch and read the subtitles of this guy calling the yellow batches “harmless” HERE.
What’s a mild severe adverse event (SAE)?
I’m not trying to nit pick at the language barrier or translation, but more than a couple of times I got confused in the technical reading trying to decipher when the authors meant AE or SAE.
The Eagle’s summary:
This Study is bitter sweet for me, on the one hand I’m glad the blue, green, yellow dots have been updated to reflect what I’ve been harping on. I doubt these authors will ever openly declare there are a minimum of 7 deaths in the yellow dots along with these other ~250 Severe Adverse Events (SAEs), however the yellow dot trend line did move most significantly by comparison.
Even more sadly, it’s not obvious to the authors the concept of “throttling” or purposeful delay in publishing reports as to the reason for all your backlog? That’s a hell of a lot of backlog, that it more than doubled their initial data. Don’t forget how much day lag the initial data had from last vax date to the days Denmark authors had to crunch and publish the data way back in March 2023.
There was another concept completely missing, unspoken, unmentioned or unidentified. This is called coding to ultimate specificity. The example is how Denmark now has 34,410 registrants consisting of 93,245 SAEs or 2.71 SAEs per report. Conversely Sweden has 56,784 registrants consisting of 219,731 SAEs or 3.87 SAEs per report. This is clearly a big difference and could dramatically skew the comparisons. Coding a single report to it’s highest level SAE only, would help eliminate some ambiguity and vulnerability in this study. What if Denmark report says the victim is dead, while Sweden’s report says hospitalized, life threatening, permanent disability, and the victim died? Dead is dead!
Sweden averaged a 1 whole SAE more per report. Did Demark just mark hospitalization while Sweden marked Life Threatening and Hospitalization on every report? Isn’t this a little arbitrary? Aren’t they called event levels for a reason? You can almost consider it double counting or in a different environment we could say that Sweden codes and documents a lot better than Denmark does. However, for the purpose of a study like this it’s a valid critique and request that a additional parallel report be done coding SAEs to ultimate specificity with 1 SAE = 1 report = 1 victim. God Bless
Yo Denmark, give me the data and I’ll do it for FREE and make you a slick interactive dashboard like this one here:
https://www.vaersaware.com/schmeling-denmark-lot-study
Please support The Eagle!


Albert is your https://www.vaersaware.com/schmeling-denmark-lot-study dashboard the reports that come into US VAERS?
You have no explanation on the page.
Great analysis Albert. If I had been invited as a referee, I would have requested the journal to only allow publication of graphs with number of injured jabees per million doses actually given to be plotted. Plus of course the data spreadsheet.
Note "The raw data supporting the conclusions of this article will be made available by the authors on request."
"Since data on the number of doses administered per individual batch during the latter part of the examined period were not made available to us by the SSI despite repeated requests, we limited the current direct comparison with data from Sweden to the 52 batches (including batches that were shared between the two countries) used in the period from 27 December 2020 to 11 January 2022, for which we previously found a < 0.15% difference between numbers of shipped and administered doses in Denmark " makes the Manniche et al analysis useless in 2024.