VAERS New Data Sept 22, Weekly Wrap-up.
RSV Reports are starting to appear on the radar. Throttle con job going strong.
I don’t know how VAERS keeps getting away with this throttle con job. I’m wanting and hoping peeps will go into the dashboard and check out and co-sign on the stats I’m presenting here. I should have also put in the meme above there were an extra six deaths that were non-covid, but I really want to alert you to the RSV trend.
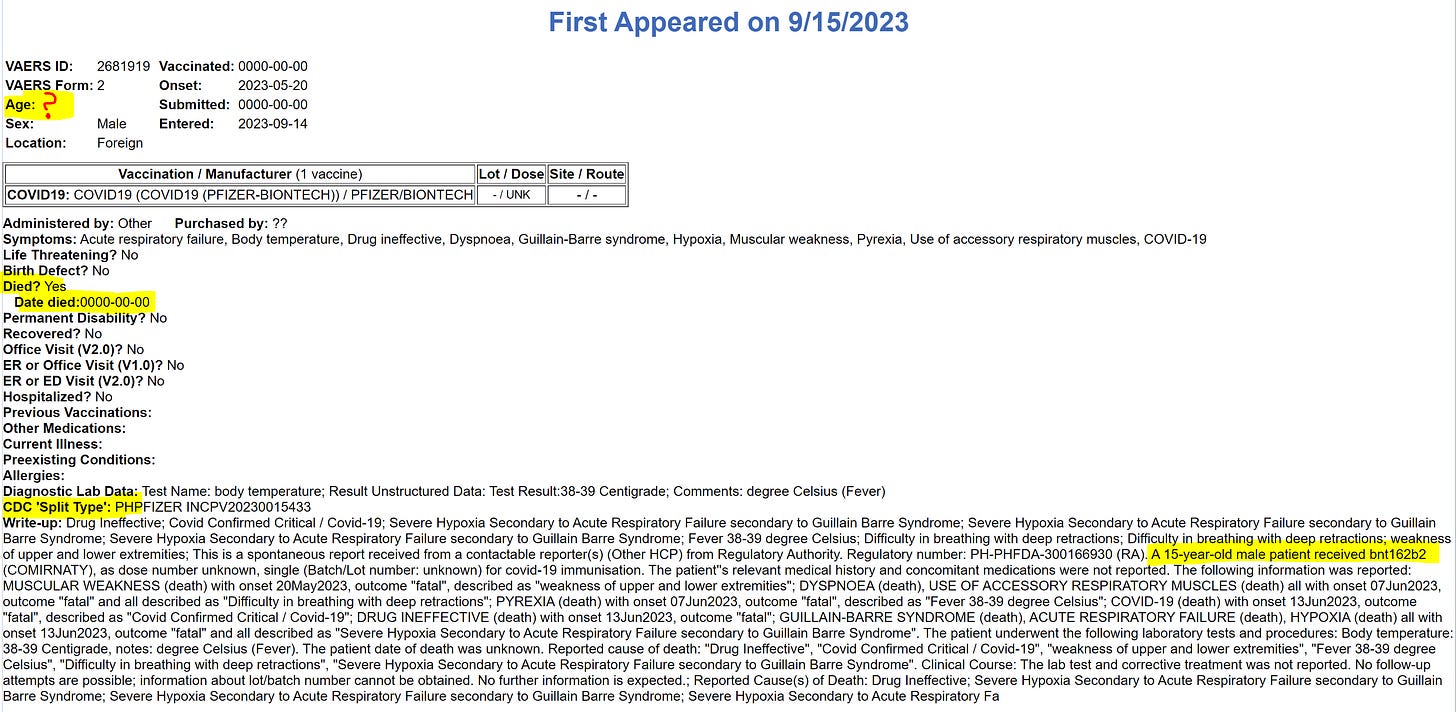
I want to honor the one dead kid, primarily because VAERS hides these children deaths by omitting the age from the age field, like this new kid death.:
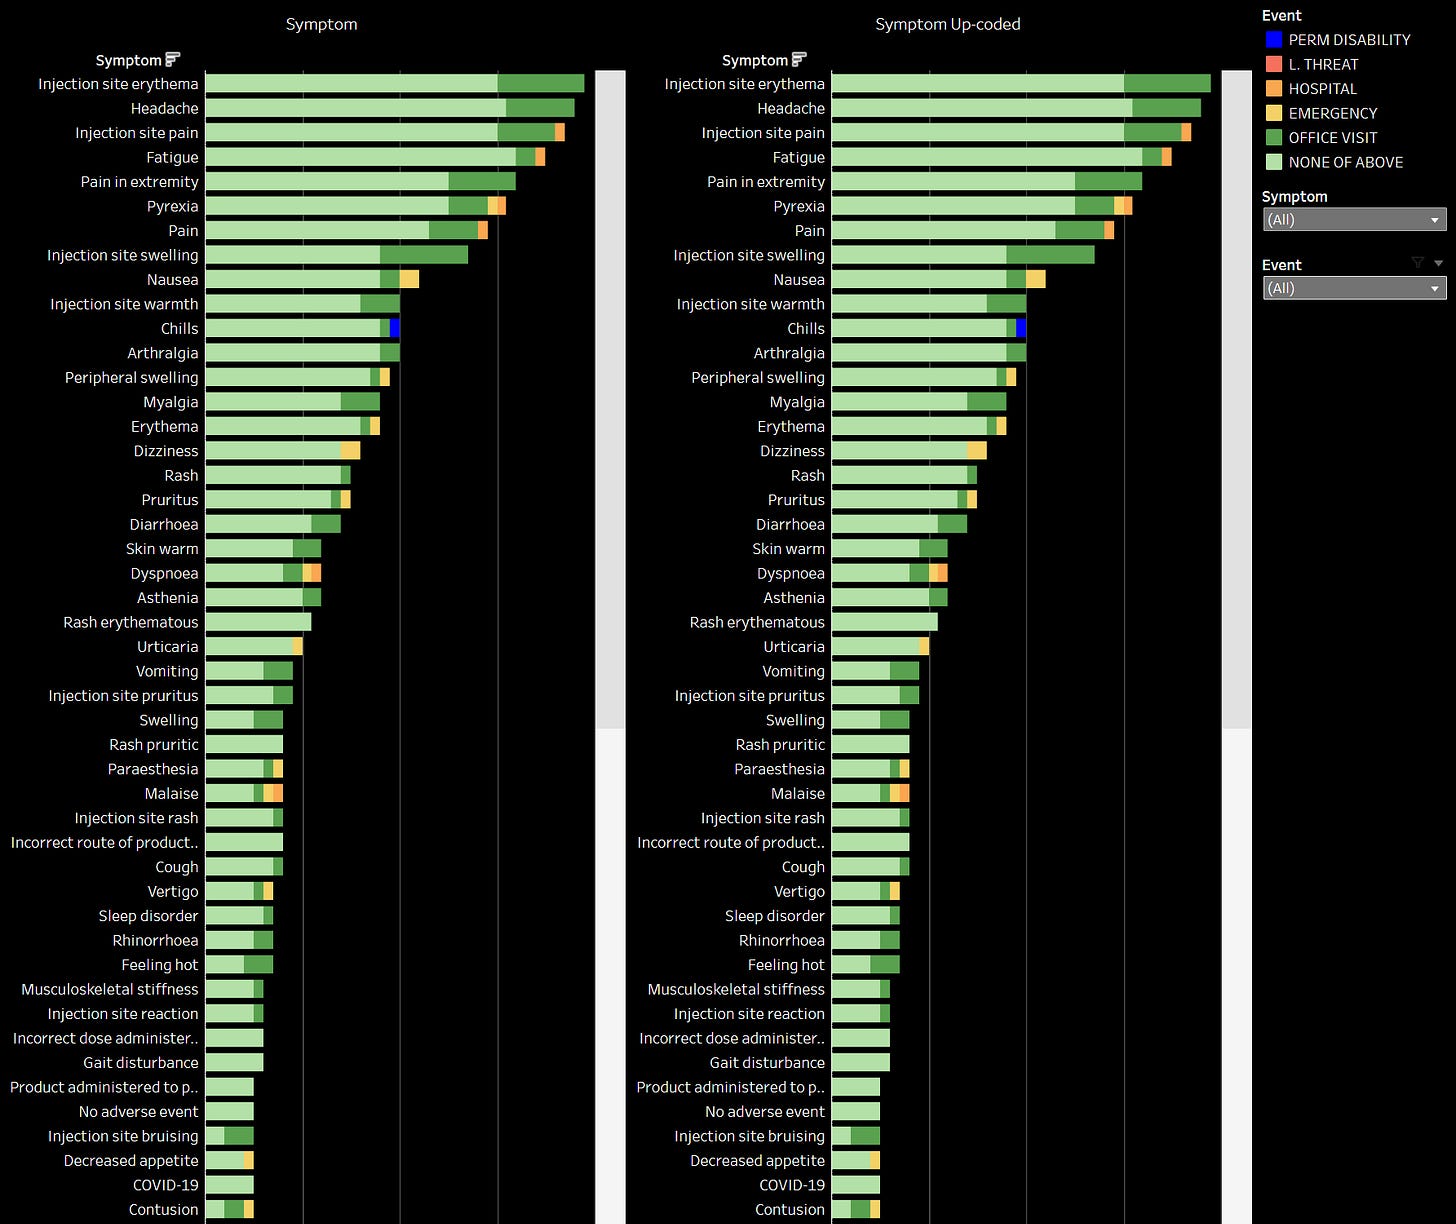
To date there are 274 RSV reports in VAERS, 118 of these were just published in this new batch of reports. Here is what the visuals on RSV look like.:
There is a lot to soak in as the RSV data is starting to roll in. A couple of things that stand out is the disproportion of females to males, and the types of symptoms. It seems there is a lot of injection site pain, swelling, rashes, and itching? The symptom rank profile looks a little different than Covid-19 jabs. I wonder if this is indicative of melanomas to follow?
I was working on a adverse event relative toxicity by state analysis to kind of answer this red state blue state issue that seems to exist no matter which way we slice the pie. I think this visual represents the fairest, true, most relative ranking….
There is something crazy going on with Michigan and all their hospitalizations. Michigan would drop to around the mid teens in rank if the had 5,000 less hospitalizations. As it stands Michigan is the biggest state with the highest rank. New York and California should be coming in with some big numbers but they are not relatively speaking. I’m thinking Michigan is not an outlier or an anomaly, but rather closer to a more realistic ratio of jabbed to hospitalizations? What would the death count look like if every state had Kentucky’s death to jab ratio? Do you see what I’m getting at? It’s like that goofy metric LD50 or aka Lethal Dose 50%
From Wikipedia, the free encyclopedia
"LD50" redirects here. For other uses, see LD50 (disambiguation).
In toxicology, the median lethal dose, LD50 (abbreviation for "lethal dose, 50%"), LC50 (lethal concentration, 50%) or LCt50 is a toxic unit that measures the lethal dose of a given substance.[1] The value of LD50 for a substance is the dose required to kill half the members of a tested population after a specified test duration. LD50 figures are frequently used as a general indicator of a substance's acute toxicity. A lower LD50 is indicative of increased toxicity.
I’m going to give my analysis a clever name like SE100 aka Severe Event 100% aka take the highest event ratio per event level and apply that to all states.
Here is an example:
South Dakota has the highest amount of death reports to population jabbed at 287 deaths to 714,510 South Dakotan’s jabbed or a ratio of 0.0004017%
Correlating to California’s population of ~33M to S. Dakota’s death ratio, California would have 13,287 deaths.
New York’s population of 18M would have 7,355 deaths.
Wow! Instead of the Simpson Paradox we can call it the SE100 Paradox to compensate for all the legitimate reports submitted to VAERS but never get published and/or never get updated like my friend Michelle Utter, and all the suppressed reports that now never get created by the gatekeepers. Wow again! What happens when we Kirsch 41x the SE100 Paradox? We still need to apply the Eagle’s 2x factor to Kirsch’s 41x to get into reality.
I will include actual spreadsheet for download below for my paid subscribers, but I wanted to show you one last interesting observation between red and blue states.
Observe this, less people over all were jabbed in red states (102M) versus blue states (161M), yet red states have more VAERS deaths (6,402) than blue states (5,872). We have to remember there are exactly 5,846 domestic deaths from UNKNOWN states, so the red/blue thing may not mean shit and be a moot point. But for every other event level the Blue states are recording more events as should be expected, in many cases almost doubling the red state’s counts in every category.
This Downloadable file below:
Keep reading with a 7-day free trial
Subscribe to WelcomeTheEagle’s Substack to keep reading this post and get 7 days of free access to the full post archives.


