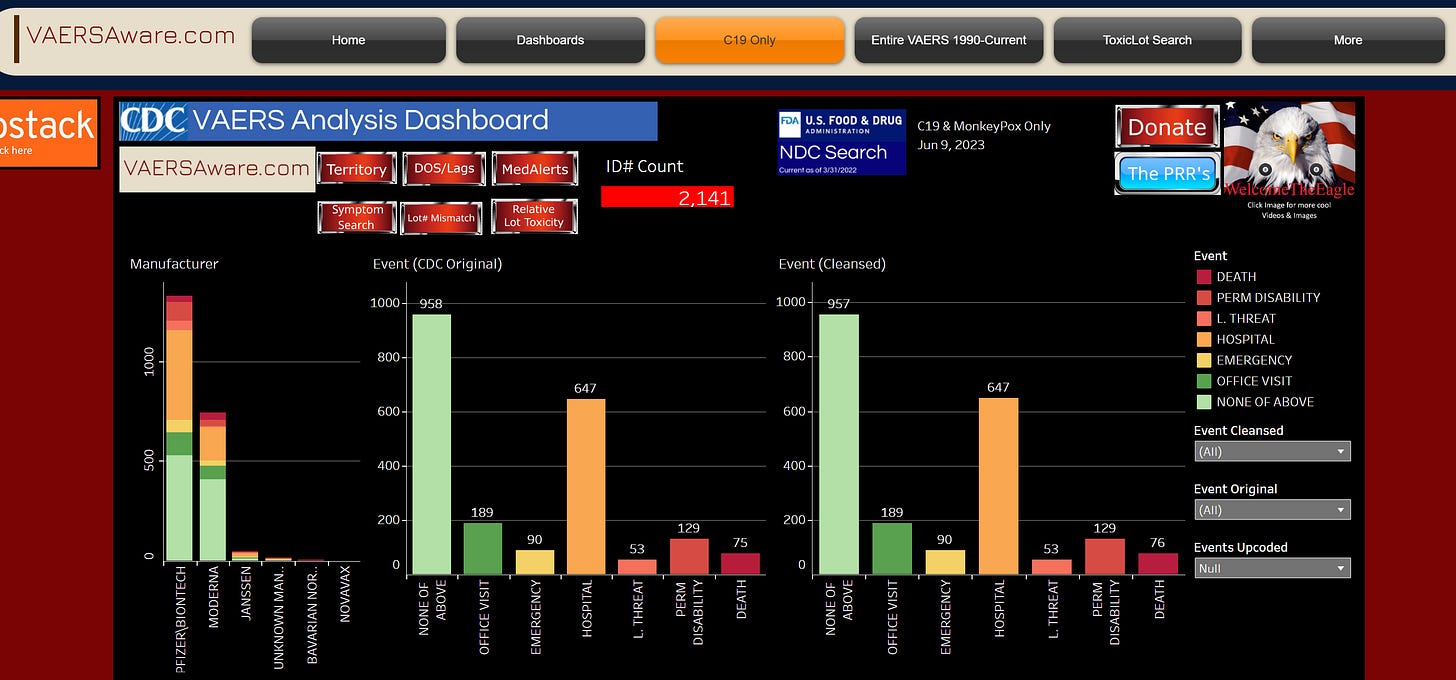
VAERS Jun9, 2023 Wrap Up!
They took a break from mass purging, but didn't take a break from throttling!
Looking at only “new” reports this week for C19/MonkeyPox only, by vax date:
There was one extra death they “up-coded” from the week before, it was ID# 2636755 and it was one I tweeted about last week.
It’s clear they are pumping in a high percentage of SAE’s in relation to what they were publishing before. It’s actually worth a new visualization on my dashboard so that’s something on my list of to do’s.
By vax date that big spike on Jan 20, 2021 is VAERS version of flipping you the middle finger!
By isolating only the SAE’s we see a cluster from Nov 21 to Feb 2022, and healthy dose of reports pre Nov 2021. A disclaimer about the front end spike late May 2023, there were at least 233 reports where there was no vax or onset date so I used the next best date available which in many cases was the VAERS received date. A dynamic algorithm for these types of reports extracting a vax date or onset date from the summary narrative would be awesome. I do a little old fashion Aztec hunting as I’m modeling the data each week and quickly find the low hanging fruit on missing vax and death dates. I actually have many more filters and search capabilities that do not appear on my dashboard but are available to me. It’s a balance of making something simplified for the masses and making something for the grizzled auditor.
So only looking at data by vax date begs the question for the pro-vaxx audience, well how long did it take for the victim to develop symptoms (onset date)? Maybe it took them a couple years to develop symptoms and even then how could they know it was from the depop shot? Good question grasshopper, let’s dive a little deeper! The guppies swim at the top, the whales swim deep.
Here is where you see the throttling start to show itself.
By onset date you start to see not many have long onsets in relation to old vax dates, that’s clue #1. The date VAERS received to date published is the emperor wears no clothes graph! You can see that spike of about 200 reports where VAERS held onto the report 868 days for mostly None of Above, and some Emergency level reports. Peeling the onion you can see the batch of 32 DEATH reports and 6 Hospitalizations they held onto for 586 days. Absolutely incredible, they basically do this every week, but that’s not the only throttling there is. The delay in hospitals and manufactures actually submitting reports to VAERS is another throttle job hiding in the Kool-Aid.
This simplified look at deaths organized by oldest death date, now look at #3, #7, #40-#47. These all look to be processed by VAERS very efficiently, almost to fast if you ask me and considering lot#s they also routinely leave off. How much work is really going into vetting these particular reports and/or requesting additional info so we can have a more robust picture? Look CDC/FDA is big pharma’s lap dog they are in bed together, There is no doubt in my mind and my opinion VAERS and the manufactures are manipulating dates of when they say they are becoming aware of these SAE reports. But oh well at least I can say 39 of 76 (51%) of “new” deaths reported Jun 9, 2023 actually died in 2021!!!
~47 of 76 (62%) deaths were heavily throttled? 11 “new” deaths are left UNDETERMINED and no doubt in my mind at least half of those are heavily throttled as well. Talk about serving up a turd sandwich but calling it a hamburger. Could we wish for a little cheese on our turd sandwich and at least tell us what states they came from? No dice, they pee in your cup and call that lemonade.
Interesting most of the heavily throttled “None of Above” aka the lowest level AE aka safe & effective were NOT administration errors type reports like temperature excursions, storage errors, needle issues, etc.. many of these are actually pretty serious reports when reading the reports and looking at symptoms. They also are UNK state except for 3 from Ohio…
The big spike in Hospitalizations mostly coming from UNK territories/state, but there is something always going on with Michigan and hospitalizations.
Here is the running totals on all domestic SAE’s… I wonder how many of the Michigan hospitalizations are now since dead?
Please poke around the dashboard by clicking the logo! God Bless


76 deaths out of 2100 reporting is about >1:300, which is quite a lot, since so few actually report! Permanently handicapped? [126 out of 2100 reported, would be > 1/20th, or 1:20 or reported cases, wouldn't it?]
These seem like horrible outcomes to me.